Table of contents
Open Table of contents
What Should I Ingest Into My SIEM?
A couple of years ago, I wrote about SIEM Log Source Management — about how to manage the security telemetry you are ingesting into your SIEM from a full lifecycle perspective. However, as I’ve spent a lot of time over the last half a year or so helping folks get up and running in their SIEM, I’ve discovered that many organizations have trouble with step 0: figuring out what to ingest. While some orgs have a very good idea of what data they want, why they want it, and what they’ll do with it. Many, many more don’t.
People spend weeks ripping their hair out and kicking and screaming at network administrators to get firewall logs ingested into the SIEM, spend a gajillion dollars to do so, and then, when asked, can’t meaningfully answer… why? Why do you need those firewall logs? What are you going to do with them? How are you going to do that?
In turn, I am questioned: what should I do? What telemetry do I need? Why do I need it? What should I do with it?
I’m glad you asked.
TL;DR:
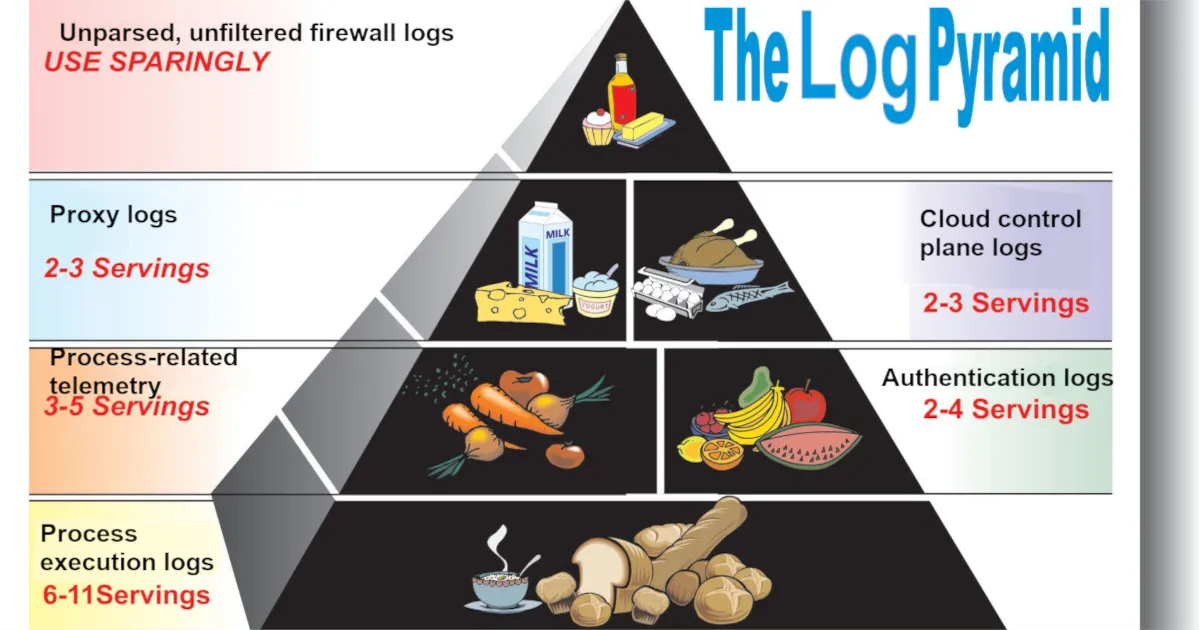
It all depends on your budget. If you have infinite money, ingest everything. Why not? If you, like most folks, don’t live with that reality, I recommend the following telemetry sources, in rough order:
If you want to write detection rules in your SIEM to catch threats, ingest:
- Process creation and process-related telemetry*, particularly:
- File modifications
- Network connections
- Module loads
- Windows registry modifications (these may be omitted if too voluminous)
- EDR/malware/antivirus alerts*
- Authentication telemetry, in order of importance:
- Cloud (e.g., Entra/Okta sign-in logs)
- VPN (e.g., GlobalProtect, AnyConnect)
- On-prem (e.g., Active Directory)
- Cloud control plane and audit telemetry
- Email audit/activity logs (e.g., mailbox rule creation)
- Web proxy logs
- Network Intrusion Detection System (NIDS) alerts
Some telemetry sources that are very useful for threat investigation, but (generally) not as important for threat detection:
- Email sent/received logs
- Web Application Firewall (WAF) alerts
- Basic internal network traffic metadata (timestamp, source IP, destination IP, source port, destination port, X-Forwarded-For, protocol, bytes sent, bytes received, allowed/denied)
- Note: I did not say full firewall logging for inbound traffic to public-facing firewalls. That is generally not a good use of money.
- Web server access logs
- User/group management telemetry (note: this is also often useful for fulfilling compliance requirements)
*If you can write detection rules in your EDR/XDR platform, you may feel free to keep that telemetry there without forwarding it to a SIEM for cost savings purposes. Generally, however, you should be aware that such platforms generally have lower data retention periods, lower quality native detection capabilities, and that you may regret not being able to cross-reference data that exists in your SIEM with data that only lives within your XDR platform.
Frameworks
There are a million frameworks and standards that at least partially help to identify what you should log. Whether they help you with what logs you should forward to the SIEM is another story. In the appendix, I go over a few supplementary reading materials and discuss how they are helpful in informing a logging strategy.
Here, I will focus on just MITRE ATT&CK and Sigma.
MITRE ATT&CK

MITRE ATT&CK, as a project, is not limited to just enumerating attacker techniques. Offshoots of the project include other tools for helping defenders, including Detection Strategies, Analytics, and Data Components.
MITRE’s Detection Strategies are high-level descriptions of how to detect a MITRE ATT&CK technique. Each Detection Strategy contains one or more detection Analytics. Analytics are lower-level descriptions of what to detect on a per-platform basis, providing you with relevant Data Components (log sources) required to detect such activity. This diagram best explains the relationship between these moving parts:
flowchart TD
    DC[MITRE Data Components]
    AN[MITRE Analytics]
    DET[MITRE Detection Strategies]
    ATT[MITRE ATT&CK Techniques]

    DC -->|used by| AN
    AN -->|contained in| DET
    DET -->|mapped to| ATT
With these tools, we can effectively map data sources to how many ATT&CK techniques they are able to provide insight into. Now, while not all MITRE ATT&CK techniques are equally prevalent in adversary activity, there is indeed a rough correlation between the quantity of ATT&CK techniques detectable via a data source and the value of that data source.
I yelled at my robot to produce a command-line tool to interact with MITRE’s STIX endpoint and aggregate this information for me. After spot-checking the robot’s work, I found some interesting results:
python mitre-datacomponent-attack-mapper.py --top 30Top 30 Data Components by Unique Technique Count
------------------------------------------------
1. Process Creation 452
2. Command Execution 209
3. File Creation 174
4. Network Connection Creation 151
5. Network Traffic Content 139
6. File Modification 115
7. Module Load 109
8. Application Log Content 98
9. Network Traffic Flow 92
10. File Access 91
11. Windows Registry Key Modification 86
12. Process Access 77
13. File Metadata 64
14. Logon Session Creation 56
15. OS API Execution 54
16. User Account Authentication 53
17. Logon Session Metadata 30
18. Process Metadata 30
19. Script Execution 28
20. Service Creation 28
21. Response Content 28
22. Process Modification 24
23. User Account Modification 21
24. User Account Metadata 20
25. Cloud Service Modification 18
26. Active Directory Object Modification 17
27. Scheduled Job Creation 15
28. Driver Load 14
29. Host Status 14
30. Service Metadata 13This is great. With this, we can see the quantity of MITRE techniques that can be identified on a per-Data Component basis. Before further discussion, I want to talk about what originally led me to this thought exercise: DETT&CT.
DETT&CT, from Rabobank, is a project that leverages MITRE ATT&CK and Data Sources (the predecessor to Data Components) to help organizations understand their detection visibility and coverage. The project also undertook a familiar task:
Using the command
python dettect.py generic -ds, you can determine which data sources within ATT&CK cover the most techniques. This can, for example, be useful to guide you in identifying which data sources will provide you with a lot of visibility and are hence a good candidate to have available in a SIEM (like) solution.
Although the project hasn’t yet moved from Data Sources to Data Components, you can still work with it by pointing it at a local STIX file that predates MITRE ATT&CK v18. These are downloadable from the source code ZIP on MITRE’s GitHub.
With the command line utility, we can uncover familiar results:
python dettect.py generic -ds --local-stix-path ./attack-stix-data-17.1Count Data Source Platform(s)
------------------------------------------------------------------------------------------------------------------------
297 Command Execution Containers, ESXi, Linux, Network Devices, Windows, macOS
261 Process Creation ESXi, Linux, Windows, macOS
116 File Creation ESXi, Linux, Network Devices, Windows, macOS
114 File Modification ESXi, Linux, Network Devices, Windows, macOS
103 Network Traffic Flow ESXi, IaaS, Linux, Windows, macOS
102 OS API Execution ESXi, Linux, Windows, macOS
94 Application Log Content ESXi, IaaS, Linux, Office Suite, SaaS, Windows, macOS
92 Network Traffic Content ESXi, IaaS, Linux, Windows, macOS
68 Network Connection Creation ESXi, IaaS, Linux, Windows, macOS
68 Windows Registry Key Modification Windows
58 Module Load Linux, Windows, macOS
51 File Metadata ESXi, Linux, Network Devices, Windows, macOS
50 File Access ESXi, Linux, Network Devices, Windows, macOS
48 Web [DeTT&CT data source] Windows, macOS, Linux, IaaS, Office Suite, SaaS, Network Devices,
Containers
41 Logon Session Creation ESXi, IaaS, Identity Provider, Linux, Office Suite, SaaS, Windows,
macOS
33 Script Execution ESXi, Windows
28 Response Content PRE
27 User Account Authentication Containers, ESXi, IaaS, Identity Provider, Linux, Office Suite, SaaS,
Windows, macOS
23 Windows Registry Key Creation Windows
21 Process Access ESXi, Linux, Windows, macOS
21 Internal DNS [DeTT&CT data source] Windows, macOS, Linux, IaaS, Network Devices, Containers
20 Active Directory Object Modification Identity Provider, Windows
19 Host Status Linux, Windows, macOS
19 Process Metadata ESXi, Linux, Windows, macOS
18 Email [DeTT&CT data source] Windows, macOS, Linux, Office Suite, SaaS
15 Service Creation ESXi, Linux, Windows, macOS
15 File Deletion ESXi, Linux, Network Devices, Windows, macOS
15 User Account Modification Containers, ESXi, IaaS, Identity Provider, Linux, Office
<results truncated>So, between these two tools, both leveraging MITRE ATT&CK from different perspectives and made at different points in time, what have we learned?
If you want to have breadth of ability to detect threats, process execution telemetry is critically important. In terms of the number of raw techniques that are observable from telemetry, nothing beats process execution and command execution (which are almost always available in the same telemetry source).
Furthermore, process-related telemetry is important. File writes, network connections, module loads, and Windows registry writes, on an endpoint, are all performed by processes. In this way, processes are king. If you want to cast a wide net in your ability to detect threatening activity that may be happening on an endpoint, you look at what processes are doing.
And while processes do have network-related telemetry, and we know that network telemetry is important, we know that it’s not only relevant in the context of an executing process. It wasn’t that long ago that many of us spent most of our time thinking about PCAPs and how to best write Snort rules. Does that mean you should start ingesting every allow/block log for the public-facing firewall in front of your company website into your SIEM? Not at all.
Regarding network telemetry, I will speak from experience on what is good to ingest into a SIEM:
- Web proxy logs (shown as web in DETT&CT)
- By far, the biggest bang for buck network evidence source. If your organization’s workstations route web traffic through a web proxy or secure web gateway (E.g., Squid), this is a fantastic and rich evidence source. Web proxy logs are critical in identifying initial intrusion via malware infestation by drive-by download, insider threat investigations, and more.
- Network Intrusion Detection System (NIDS) alerts. This includes any IDS/PS capability built into a firewall.
- Depending on the severity of volume, you may want to be selective about how you ingest this for public-facing firewalls.
- Basic metadata for internal network traffic
- For key network junctions, instead of capturing all traffic metadata under the sun, you should strive to capture the minimum needed to identify lateral movement/data exfiltration. The minimum would be the 5-tuple flow fields: source IP, destination IP, source port, destination port, and protocol, but you might also want to capture X-Forwarded-For (as applicable), data sent, data received, and whether traffic was allowed/denied.
Sigma
![]()
MITRE ATT&CK, while excellent, is a bit theoretical. A data source mapping to a lot of techniques does not necessarily mean that those are at all common or noteworthy techniques. If we want to be more practical, one resource that we can look into is detection rulesets. These, designed to detect threats, should at least give us some indication as to what data sources are relevant in threat detection. For this, I’ll look to Sigma.
Sigma, a backend-agnostic detection engineering language, also features a significant quantity of open source rules in its GitHub repository. How can we use this in understanding what data sources are valuable for ingestion? Well, every Sigma rule features a snippet describing what log sources (product, category, and service) are to be searched under the logsource key:
logsource:
    product: linux
    category: process_creation
    service: auditlogs
Because all of this data exists in a structured format, we can just parse the rules and identify how many times things like log sources show up across rules. I again yelled at my robot to throw together a quick little script for that (and checked the script’s results). Here’s what I found:
python .\sigma-logsource-attack-mapper.py --sigma-repo ../../Sigma --top 15Top 15 Logsources by Rule Count (product+category+service)
----------------------------------------------------------
1. product=windows | category=process_creation | service=- 1299
2. product=windows | category=registry_set | service=- 206
3. product=windows | category=file_event | service=- 196
4. product=windows | category=ps_script | service=- 174
5. product=windows | category=- | service=security 165
6. product=linux | category=process_creation | service=- 120
7. product=windows | category=image_load | service=- 112
8. product=- | category=webserver | service=- 78
9. product=windows | category=- | service=system 72
10. product=macos | category=process_creation | service=- 66
11. product=windows | category=network_connection | service=- 60
12. product=- | category=proxy | service=- 53
13. product=linux | category=- | service=auditd 48
14. product=azure | category=- | service=activitylogs 43
15. product=aws | category=- | service=cloudtrail 42
Top 15 Logsources by Technique Coverage (product+category+service)
------------------------------------------------------------------
1. product=windows | category=process_creation | service=- 231 distinct technique(s)
2. product=windows | category=ps_script | service=- 103 distinct technique(s)
3. product=windows | category=- | service=security 93 distinct technique(s)
4. product=windows | category=file_event | service=- 80 distinct technique(s)
5. product=macos | category=process_creation | service=- 57 distinct technique(s)
6. product=linux | category=process_creation | service=- 55 distinct technique(s)
7. product=windows | category=registry_set | service=- 55 distinct technique(s)
8. product=linux | category=- | service=auditd 39 distinct technique(s)
9. product=windows | category=network_connection | service=- 36 distinct technique(s)
10. product=cisco | category=- | service=aaa 33 distinct technique(s)
11. product=windows | category=image_load | service=- 32 distinct technique(s)
12. product=aws | category=- | service=cloudtrail 31 distinct technique(s)
13. product=windows | category=- | service=system 30 distinct technique(s)
14. product=windows | category=registry_event | service=- 29 distinct technique(s)
15. product=azure | category=- | service=activitylogs 21 distinct technique(s)There are a few different ways to look at this data. The results shown here are aggregated on a tuple of product+category+service. My favorite view, however, is to aggregate just on category:
python sigma-logsource-attack-mapper.py --sigma-repo ../../Sigma --top 15 --logsource-views categoryTop 15 Logsources by Rule Count (category)
------------------------------------------
1. category=process_creation 1485
2. category=- 768
3. category=file_event 210
4. category=registry_set 206
5. category=ps_script 174
6. category=image_load 112
7. category=webserver 78
8. category=network_connection 65
9. category=application 58
10. category=proxy 53
11. category=registry_event 39
12. category=ps_module 34
13. category=process_access 26
14. category=dns_query 22
15. category=pipe_created 19
Top 15 Logsources by Technique Coverage (category)
--------------------------------------------------
1. category=process_creation 262 distinct technique(s)
2. category=- 219 distinct technique(s)
3. category=ps_script 103 distinct technique(s)
4. category=file_event 84 distinct technique(s)
5. category=registry_set 55 distinct technique(s)
6. category=network_connection 37 distinct technique(s)
7. category=image_load 32 distinct technique(s)
8. category=registry_event 29 distinct technique(s)
9. category=application 28 distinct technique(s)
10. category=ps_module 20 distinct technique(s)
11. category=proxy 19 distinct technique(s)
12. category=process_access 14 distinct technique(s)
13. category=dns_query 13 distinct technique(s)
14. category=pipe_created 13 distinct technique(s)
15. category=create_remote_thread 12 distinct technique(s)Finally, I want to take one more look. This time, filtering for just active, stable rules, with techniques, as these should largely be the highest quality:
python sigma-logsource-attack-mapper.py --require-techniques --top 15 --logsource-views service --status-filter stable --sigma-repo ../../SigmaTop 15 Logsources by Rule Count (category)
------------------------------------------
1. category=process_creation 44
2. category=- 32
3. category=application 4
4. category=antivirus 4
5. category=process_access 3
6. category=file_event 2
7. category=network_connection 2
8. category=proxy 2
9. category=dns 1
10. category=create_remote_thread 1
11. category=image_load 1
12. category=ps_classic_start 1
13. category=registry_event 1
14. category=registry_set 1
15. category=webserver 1
Top 15 Logsources by Technique Coverage (category)
--------------------------------------------------
1. category=process_creation 46 distinct technique(s)
2. category=- 22 distinct technique(s)
3. category=antivirus 8 distinct technique(s)
4. category=process_access 5 distinct technique(s)
5. category=proxy 3 distinct technique(s)
6. category=dns 2 distinct technique(s)
7. category=file_event 2 distinct technique(s)
8. category=application 1 distinct technique(s)
9. category=create_remote_thread 1 distinct technique(s)
10. category=image_load 1 distinct technique(s)
11. category=network_connection 1 distinct technique(s)
12. category=ps_classic_start 1 distinct technique(s)
13. category=registry_event 1 distinct technique(s)
14. category=registry_set 1 distinct technique(s)
15. category=webserver 1 distinct technique(s)What can we glean from all these results? Largely, we can see that our understanding that process telemetry is valuable was, indeed, correct. But we also identify a few potentially useful additional evidence sources:
- Antivirus logs
- Largely not an actual separate category to consider, as, if you have an EDR tool, AV alerts will find their way into your case management or SIEM tool anyway. It can be easy to forget that these super low-volume logs have a very high correlation with some flavor of threat being present.
- Web server access logs
- Web server access logs show up a lot in discussions on emerging threats. Often, the most significant of vulnerabilities are for those affecting web servers, for which exploitation is often identifiable via web server access logs. Personally, I believe the value of these logs in a SIEM, particularly if exceptionally voluminous, is debatable. If you have a WAF, it should provide you with information pertaining to attempted exploitation. Additionally, activity following the exploitation of a web server is going to come in the form of process telemetry, which you should already be capturing. I’ll classify WAF alerts as good (though potentially requiring filtering upon ingestion) and web server access logs as nice to have.
- DNS logs
- An oldie but (maybe) a goody: DNS logs let you know what domains are being resolved for on your network. Since most flavor of evil includes some form of C2, DNS can be a great place to look. Why do I say maybe a goody, then? Because they are extremely voluminous, and if you are already capturing process network telemetry, web proxy logs, and basic network traffic metadata, they may not be an extreme value add. Still, nice to have, particularly if dealing with unmanaged endpoints.
- User & group management logs
- Under the category of “security” are some rules related to group management. It is conceptually very easy to understand why these logs might be of use: adversaries, while establishing persistence and escalating privileges, may create/modify users and groups or modify existing group memberships. In practice, though, I’ve found this evidence source to be more useful for compliance and identity hygiene-related tasks. Adversary-related user/group management is often visible via process creation telemetry (e.g., via execution of
net.exe).
- Under the category of “security” are some rules related to group management. It is conceptually very easy to understand why these logs might be of use: adversaries, while establishing persistence and escalating privileges, may create/modify users and groups or modify existing group memberships. In practice, though, I’ve found this evidence source to be more useful for compliance and identity hygiene-related tasks. Adversary-related user/group management is often visible via process creation telemetry (e.g., via execution of
Largely, then, other than antivirus logs, we’re met with mostly nice-to-haves and things for which there are better evidence sources.
This sort of analysis on the Sigma rule repository has at least a few glaring issues:
- Prevalent threats are not necessarily easily captured via Sigma rules. While Sigma rules do support correlations for roughly stateful detection rules, some things, like identity-based anomalies, are not easily captured via a Sigma rule. There is no great way to capture anomalous authentication from a hosting services provider occurring from a device that is not enrolled in Entra from an anomalous geolocation for the user for the past 90 days in a Sigma rule at this time.
- Many rules are repetitive. At the time of writing, there are 22 rules for Windows Security event ID 4697, half of which target the ten‑year‑old tool
Invoke‑Obfuscation. They all boil down to a Windows service was created with evil in the service file name arguments. These rules aren’t necessarily bad by any means. Splitting them can be useful. However, it overemphasizes the importance of single event IDs. - Rules aren’t written to optimize data source usage. A rule could capture additions to the local
Administratorsgroup via command line arguments, using process‑creation telemetry. Alternatively, a rule might target Windows Security event ID 4732 for the same behavior. While it’s intuitive to use the event ID for local admin changes, identifying malicious instances is often easier with process‑creation telemetry (something you’re likely already ingesting for threat detection).
Threat Detection Reports
So far, we’ve examined abstract data‑source mappings to MITRE ATT&CK and begun identifying practical data source value via open source Sigma rules, but we continue to operate mostly in the realm of theory. Most anyone will tell you that the basic open source ruleset available from the Sigma repository will not work well in an enterprise environment without lots of tuning and gap analysis. How, then, can we figure out what adversaries are, at large, actually doing, so that we can know what data sources we need to detect them? With threat detection reports!
Since time immemorial, on a recurring basis, security organizations put out some flavor of a threat detection report. These can be great reads, particularly if the information reported is complete, accurate, relevant, and timely (CART!). Some reports focus narrowly on flavor of the month malware families. Others focus on a subset of observed behavior most relevant to the functionality of their product. Others, still, are vague about the nature of … anything they are showing you. I’m biased (I work at Red Canary), but all of this leads to me to my favorite threat detection report.
The 2026 Red Canary Threat Detection Report (which is not locked behind a business email wall) provides us with an unfiltered view of validated, actual threats. With it, a valuable tool is added to our arsenal: a listing of the top observed recent and relevant techniques.
This is work that Red Canary already did for us as part of the threat detection report, but I’ve gone ahead and mapped each of the top observed techniques to its most relevant MITRE Data Components, with any personal commentary, in the table below.
| Rank | Technique | Data Component(s) | Note |
|---|---|---|---|
| 1 | T1078.004 - Cloud Accounts | User Account Authentication/Modification, Logon Session Creation | Most identity-based threat detection is all about catching anomalous authentication, which will require auth telemetry. |
| 2 | T1059.001 - PowerShell | Process Creation, Command Execution | |
| 3 | T1059.003 - Windows Command Shell | Process Creation, Command Execution | |
| 4 | T1530 - Data from Cloud Storage | Cloud Storage Access, Creation, Deletion, and Enumeration Logs | In other words: cloud control plane activity, such as Azure’s AzureActivity table. |
| 5 | T1105 - Ingress Tool Transfer | Process Creation, Command Execution, Network Communication, and Network Connection Creation | Most malicious ingress tool transfer occurs through another process, be it curl, which you would find in your process telemetry, or a web browser, which should be identifiable in proxy telemetry. |
| 6 | T1114.003 - Email Forwarding Rule | Application Log Content | What application log, exactly? Your email application (i.e., Exchange) logging. |
| 7 | T1047 - Windows Management Instrumentation | Process Creation, Command Execution | While monitoring for WMI abuse via WMI operational logs 5860/5861 works, most of the time, WMI abuse is easily identifiable via process execution logs leveraging parent processes like wmiprvse.exe or tools like wmic.exe. |
| 8 | T1204.004 - Malicious Copy and Paste | Process Creation, Command Execution, Windows Registry Key Modification, Clipboard Data | Generally, malicious copy and paste will come in the form of adversaries tricking users into running malicious content in their Windows Run dialogue box, visible via the RunMRU key. |
| 9 | T1564.008 - Email Hiding Rules | Application Log Content | |
| 10 | T1027 - Obfuscated Files or Information | Process Creation, Command Execution, File Creation and Modification | Obfuscation typically comes in the form of aggressively jarbled or encoded command lines, visible via process telemetry. |
From this threat detection report, I’m adding three data sources we should ingest into our SIEM:
- Authentication logs
- Cloud control plane logging
- Email application audit logging (what activities are performed, not necessarily all sent/received email, though that is a nice to have.)
Can I Just Keep my XDR Data in my XDR Platform?
XDR and SIEM have a lot of overlap. Fundamentally, they both serve to help you look at a variety of things (X) so that you may detect and respond (DR) to them. Vendors like Microsoft are trying to make their XDR platforms the home of all of their first-party telemetry. For example, in Microsoft Defender XDR (security.microsoft.com), you may query your Microsoft Defender for Endpoint, Microsoft Defender for Cloud Apps, Microsoft Defender for Office 365 (and so on) telemetry all in a single place — without even forwarding to a SIEM!
So, then, should you forward that data to a traditional SIEM like Splunk or Microsoft Sentinel? Maybe!
Valuable telemetry sources are valuable telemetry sources. From a cost savings perspective, if you are able to write detection rules in your XDR platform, it may be best to keep such telemetry sources in that platform and nowhere else. However, if you want to reference or cross-reference that telemetry with other data sources that you may only ingest into your SIEM, or you want to leverage data controls (e.g., retention periods) only available to you in your SIEM… then you should put it in the SIEM.
If nothing else, sending critical telemetry to a SIEM with a long retention period allows you to better hunt for or investigate incidents that occurred in the past. If poop ever hits the fan and you need to call in an incident response firm, you’ll both be glad you kept the data around for longer than typical XDR retention periods.
Log Source Use Case Management
After I made my initial blog post on log source management, it was clear to me that I did not drive home the importance of use case management. Honestly, use case management is, to me, so important that I’m surprised it has not made its way into being a meaningful separate discipline.
One time, I encountered an environment ingesting the following (for the same endpoints!) into its SIEM:
- DeviceFileEvents from MDE
- Security event ID 4660 (An object was deleted.)
- Sysmon event ID 23 (FileDelete)
When I asked why this environment was ingesting three extremely voluminous log sources that were largely redundant with each other, I was met with a blank stare. That’s a lot of money being burned. Depending on the size of the organization, the cost of that data ingestion and retention could amount to the salaries of multiple analysts.
SIEMs are not cheap. For every data source that you ingest into a SIEM, you should put effort in to having use cases clearly defined and documented. After all, there may come a day when someone, with a clipboard and abacus, asks you to justify your expenditures.
As much as I don’t like spreadsheets, this is where they come in handy. You can create a simple spreadsheet detailing what log sources you have and why. I’ve uploaded a template you can leverage here. For a simpler version, and example, see below.
| Log Source | Criticality | In SIEM? | Use Cases | Retention (Hot Storage) |
|---|---|---|---|---|
| DeviceProcessEvents | Critical | Yes | Mandatory evidence source for threat detection on MDE-monitored endpoints in environment, capturing, most critically, file hash, file name, and process command line for executed processes | 60 days |
| DeviceFileEvents | High | Yes | Very valuable for threat detection on MDE-monitored endpoints, capturing, most critically, file hash, folder path, and file name for created/deleted files. Required for Compliance Requirement XYZ, mandating of monitoring for ransomware file extensions. | 30 days |
| EmailEvents | Medium | No | Useful in post-compromise root cause analysis and identifying phishing campaigns and scope of impacted individuals when we are targeted by a business email compromise (BEC) attack. | 30 days (Defender XDR only) |
This is a classic example of something that is not at all fun to do, but is extremely important. Here are three major reasons why data source use case management matters:
- Without use cases clearly and formally defined and documented (especially tying data sources to compliance requirements), you have little ground to stand on if someone wants a data source removed for cost savings.
- Without documented use cases, a systems architect may not account for your telemetry needs when making an infrastructure change. E.g., if an architect is set to replace your firewall appliance, but doesn’t know that you rely on its network intrusion detection system (NIDS) capability for network security monitoring in your operational technology (OT) environment, they may replace it with a dumb one instead.
- If you can’t precisely articulate why you need a data source (i.e., define your use cases), you may either not need it or not know what to do with it.
That last point is underrated. The number of organizations ingesting telemetry that they can’t define a use for is astounding.
So, I noticed that you are ingesting 2 TB of Syslog from your Cisco ISE devices. What’s up with that?”
“Oh, that? Haha. Yeah, you know. Identity is the new perimeter!”
“What can you detect with those ISE logs? Is it just RADIUS logs you’re getting from there? Or do you have the device posture check stuff in those logs, too?”
“Well, I don’t know. I think it’s all of it.”
“What can you detect with it?”
“You know. Identity stuff! User account compromise.”
“User account compromise that you’re not going to see in your Active Directory logs, Entra sign-in logs, or MFA logs, all of which you already have?”
“Well, I don’t know about that, but every little bit helps.”
“What detection rules do you have in place leveraging these logs?”
“Well, none. Our detection engineers haven’t found a use yet. The logs are unparsed, after all.”
“When have those logs been referenced during an investigation?”
“I’m not sure. Honestly, they so rarely come up, most of the analysts don’t know we have them.
The Log Sources of the Future
I’ll highlight two log sources that I anticipate being of great importance over the next few years:
Web Browser Telemetry
A significant portion of initial access now starts from the web browser. And web browser security companies are very hot right now. In 2023, Palo Alto Networks acquired Talon Cyber Security. Earlier this year, CrowdStrike acquired Seraphic, a browser security company. While web proxies are great for showing us what URLs people are visiting, having browser-level visibility enables organizations like Push Security to identify attacks like ConsentFix. I think it remains to be seen just how much telemetry security practitioners will get to work with from such products (as opposed to black box alerting), but I am certain that there will be items of use.
Large Language Model (AI!) Logging
Recently, on the Blueprint podcast from SANS, an interesting item came up: DPRK-affiliated remote workers heavily and aggressively leveraged both in-house and external large language model tools to complete tasks and blend in. Whether it’s for a niche (but severe) use case like this, or for something more bog standard, like prompt injection, the importance of logging large language model usage is only going to increase for the foreseeable future.
Appendix
Supplemental Reading
Detection Maturity Level
Source: Ryan Stillions’s Detection Maturity Level (DML)
Stillions’s DML is a great 40,000-foot view of building and maturing a detection engineering function. It breaks down detection maturity level by, roughly, abstraction. For example, only being able to detect atomic indicators, like file hashes, is not a very mature state, but being able to detect specific tactics/techniques is meaningfully mature.
On what basis you evaluate DML is up to you. For example, as noted in the blog post, you may assess your ability to detect specific adversaries. In this way, your understanding of the threat landscape can inform what things you need to detect, which informs you of what data sources you need. This is a solid approach, though I find per-adversary evaluation to be overly nuanced. For 99% of organizations, I’d first evaluate your ability to detect the most prevalent / common tactics & techniques relevant to general cyber crime.
NIST SP 800-92: Guide to Computer Security Log Management
Source: NIST SP 800-92: Guide to Computer Security Log Management
This document, while older (2006), is full of timeless truths. It provides high-level guidance on the types of telemetry that you can collect as well as how to go about creating a log management policy and what that should include. Unfortunately, I find its guidance to be a bit too high-level to be of everyday use.
NIST SP 800-137: Information Security Continuous Monitoring (ISCM)
Source: NIST SP 800-137: Information Security Continuous Monitoring (ISCM)
Another older (2011) and timeless document. It is, unfortunately, again, generally non-prescriptive about what to collect other than broad categories like security software.
CIS Controls v8.1: Control 8
Source: CIS Controls v8.1: Control 8 “Audit Log Management”
With CIS Controls, we begin to enter the realm of practicality. Control 8: Audit Log Management says that, yes, you should have a log management program (Safeguard 8.1), you should collect the logs defined by your program (Safeguard 8.2), and it even has a few very specific callouts, like Safeguards 8.6, 8.7, and 8.8, for collecting DNS, URL, and command line audit logs, respectively. While the overall control to log stuff is broad, by following CIS Benchmarks to implement the controls, you are provided with a very step-by-step and nuanced implementation plan. For example, in version 5.0 of the CIS Benchmark for Windows 11 Enterprise, chapter 17 Advanced Audit Policy Configuration provides very granular explanations of what settings need to be configured.
Joint government guidance: Best practices for event logging and threat detection
Source: Best practices for event logging and threat detection
This document, from the Australian Signals Directorate and other intelligence agencies, is uncharacteristically practical for a government document. The section titled Centralised Log Collection and Correlation, starting on page 8, provides a list of prioritized log sources. Additionally, page 6 has a Captured Event Log Details section, comprising what fields a log should possess.
I find everything in this document useful. The only issue being that, while it tells you what things are important to log from, it doesn’t do as great a job of telling you what logs are important from said systems. For example, the highest logging priority is listed as critical systems and data holdings likely to be targeted. Yes, I agree. But what logs, specifically, from such systems, are not necessarily explicit.