Table of contents
Open Table of contents
The Problem
Log source management is like asset management. It’s a critically important task, yet it remains an unsolved challenge. The number of times I’ve been in the middle of an investigation only to find myself looking for logs that stopped flowing yesterday, a week ago, a month, 6 months ago, etc. is more than I care to admit.
“What gives?” I think to myself. “We were told monitoring was in place!” And it was. But then the monitoring broke. Or the log source changed. Or the monitoring wasn’t granular enough. Or the person who implemented the monitoring wasn’t familiar with the data source and didn’t know what to look for.
Obviously, you need logs to be able to investigate things. But there’s also such a thing as too many logs. One of my earlier claims to fame was spotting an extreme increase in logs ingested by our cloud SIEM. If such a change were to happen with an on-prem SIEM, it might simply refuse to do any more processing (or even fall over due to a lack of disk space). (Un)fortunately, a cloud SIEM is happy to ingest all the logs you’re willing to give it. And the cloud provider is even more happy to bill you for the opportunity. Ouch.

Not that kind of log!
Problem Flavors
Too Many Logs!
The issue of ingesting too many logs is perhaps the easiest to “solve” (detect). Many cloud SIEM vendors natively include billing alert features to let you know when you’re spending too much money. Furthermore, it’s often not too difficult to baseline how much data you expect to receive and to trigger some kind of an alert when that amount is exceeded by a specified amount.
On-prem, the concern typically isn’t usually billing-related but performance-related. It can be easy to notice that queries are running slow. Or that the disk space is running low. Or that detection rules are timing out. Or that the primary dashboard has a big red notice saying, “you’ve exceeded your usage quota, this product is now useless!” This information should be available to you via hands-on experience, existing IT service monitoring solutions, and reporting available from the SIEM.
Regardless of where a SIEM is located, the more difficult problem is identifying the source of a log ingestion increase. I have seen very elaborate programmatic setups try to tackle this problem. Was there a massive increase in logging? From what data source? What are the most common properties that might be associated with a change in logging mechanics? Automagically accurately identifying the cause of a log ingestion increase and presenting that information with the required context to confirm the diagnosis is hard. There are a lot of variables.
I believe the “initial triage” step in diagnosing a log ingestion increase should always be the same: figure out what broad data source increased in logging. Almost always (I have never observed this not be the case), a log ingestion increase is at least specific to a certain category of platform (e.g., Windows event logs, firewall logs, switch logs, authentication service logs, web logs). Initially diagnosing the issue more granularly (e.g., Cisco firewall logs, multi-factor authentication logs) than that is certainly possible in many environments, though harder. At the very least, you should be able to quickly get a broad idea of what is driving up log ingestion.
Based on my experience, the most common causes of log ingestion increases include the following:
| Issue | How to diagnose or detect it |
|---|---|
| A change was deployed that enabled a new Windows event ID to be forwarded to the SIEM | Baseline ingestion by event ID and alert on extreme deviation. |
| A particular system has a non-standard log forwarding configuration | Baseline ingestion by source system name or source IP address and alert on extreme deviation. |
| A log forwarder or collector is duplicating logs | Baseline ingestion by collector/forwarder name and alert on extreme deviation. |
| Very broadly, some change in the environment or its behavior is excessively triggering a formerly quiet log type | After identifying the data source of the ingestion increase, iterate through the list of probable candidate fields of interest until the anomaly is spotted. |
A list of probable fields of interest includes (but is not limited to):
- Source IP address
- Destination IP address
- X-Forwarded-For address
- Source port
- Destination port
- Hostname
- Username
- Log type (e.g., for a firewall, system log vs traffic log)
- Windows event ID
- Unix logging facility
- Policy/rule name (e.g., firewall rule)
Not Enough Logs!
Unless you have a detailed understanding of every single asset that is expected to be logging (you don’t) and visibility of whether that asset is indeed logging (you definitely don’t), log outages can be difficult problems to spot.
For binary, “Is the asset logging?” questions, I’ve seen two successful approaches in identifying log outages. The first, a dynamic approach, is to identify the differences between what was logging yesterday (or a week ago, or a month ago) and today (or this morning, or this hour, or five minutes ago). When an asset is missing, generate an alert attesting to that fact. In PseudoMySQL, finding this difference might look something like this:
SELECT PreviousHosts.HostName AS MissingHost
FROM (
    SELECT DISTINCT HostName
    FROM Logs
    WHERE LogTimestamp < CURDATE() - INTERVAL 7 DAY
) AS PreviousHosts
LEFT JOIN (
    SELECT DISTINCT HostName
    FROM Logs
    WHERE LogTimestamp >= CURDATE() - INTERVAL 7 DAY
) AS CurrentHosts
ON PreviousHosts.HostName = CurrentHosts.HostName
WHERE CurrentHosts.HostName IS NULL;
The output of this query is expected to be systems that were logging 7 days ago, but not today. Then, for each result, you could dynamically send an email, create an IT break/fix ticket, etc. This dynamic approach is nice in that it has low overhead and can dynamically scale up/down as your IT asset footprint expands/shrinks. However, there are some issues with this approach:
- If an asset has never sent a log before (e.g., newly onboarded), its lack of logs will not be detected using this method
- Your ability to identify assets not currently logging is limited to as far back as your lookback period. If you have a low logging retention period or a lack of visibility into devices that previously were flagged as not logging, you can easily miss logging outages.
- Erroneous entries in the HostName field (e.g., devices reporting their hostname as being their DHCP-assigned IP address) may cause undesirable outage reports.
A more static approach (that can be treated as more “authoritative”) is to rely on your CMDB asset list. Put simply, if an asset is in the CMDB, and that asset is expected to be logging, but it is not, you can safely generate an email, ticket, etc. for each offending asset. Of course, this relies on an accurate and up-to-date CMDB. No one has one of these. Still, I prefer this strategy as being the “official” way to spot logging outages. The dynamic approach will probably always spot assets that are, for whatever reason, not in the central CMDB. These assets often tend to be “weirder” (e.g., an asset that shows its hostname as being its IP address) and might require more investigation/thought before immediately submitting a ticket/sending an email.
Not Enough of the Right Logs
The above section discussed how to answer a simple question: “Is the asset logging?” Log outages are often much more nuanced than that.
Once, I identified that some firewall logs were missing from the SIEM. I thought that was odd, as we had very robust monitoring in place to tell us if a firewall stopped forwarding logs. I ran my firewall log query and got a distinct listing of relevant firewall hostnames from the last hour. All of the expected firewalls were there! What gives? Digging deeper, I was able to identify that the firewall’s system logs (e.g., update check status logs) were successfully being forwarded, but all of the traffic logs stopped forwarding.
I don’t think it is always possible to proactively mitigate that issue. Log forwarding outages are to be expected on a per-host basis, for sure, and that should always be checked. But outages of certain types of logs from those same devices? How can we proactively know that this issue will crop up? What types of logs are expected to have issues? What field can those “types” be found in? Are there multiple types of logs that might have issues? Might those be separated across multiple different fields? What if a log forwarding issue is nested? Drawing from my previous example, what if 1. the firewall is forwarding logs, 2. the firewall is forwarding traffic logs, but 3. the firewall is not forwarding traffic logs related to a specific interface? There’s no reasonable way (with which I am familiar) to preemptively account for that contingency. I think such monitoring can only be built out after an issue proves to be something to watch out for.
Simple Visual Solutions
Ideally, some sort of alerting should always be in place to detect general excessive logging and log outages at least on the basis of hostname. But this is hard. And this strategy will always leave gaps. I think the best way to handle these sorts of gaps is with visual management: a log source health dashboard. I recommend checking out your SIEM’s native graph visualization options for this. I’ve also seen Grafana and SquaredUp successfully leveraged for this purpose.
A log source health dashboard is not something that is quick to set up (though it can be easy). But, compared to automated log outage detection, leveraging scripts, a CMDB, an IT ticket management system, etc… it’s not so bad. I have a few favorite dashboard visualizations.
Normalized or Scaled Broad Data Source Health
Creating a graph of logs over time for different broad data sources sounds great until you do it. Typically, you end up with something like this:
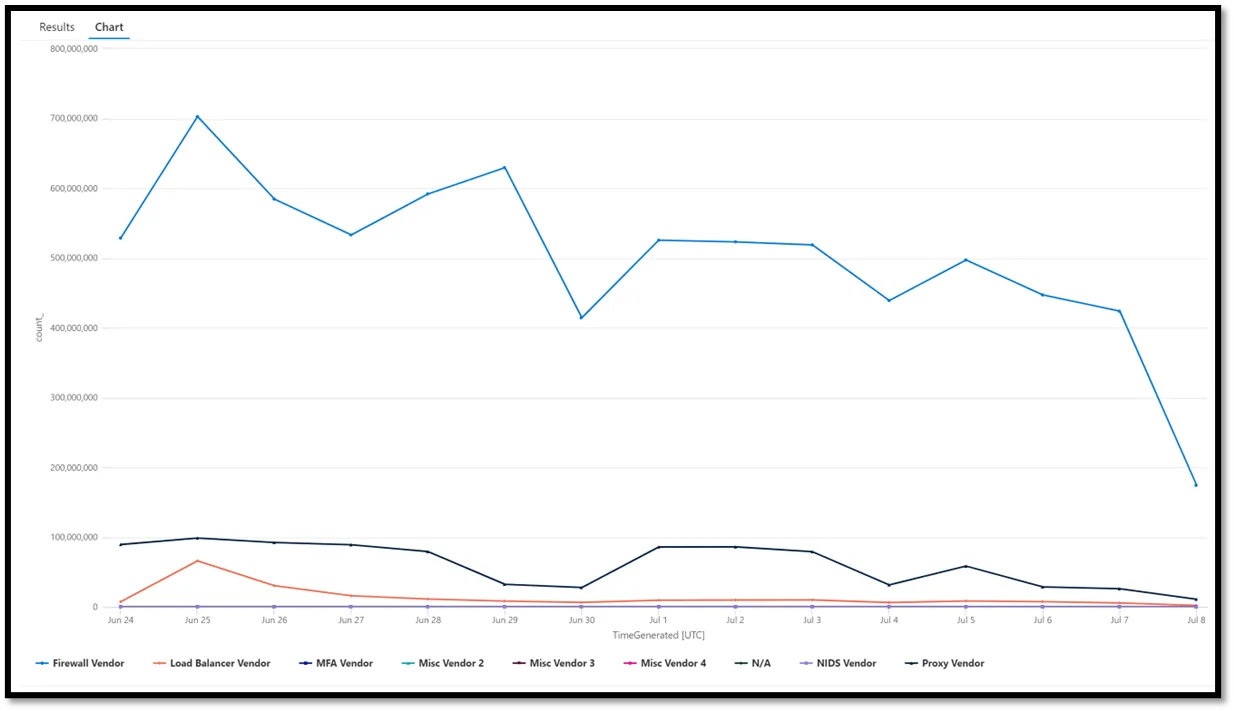 This sucks. Is the MFA Vendor having an outage? Is it even on that graph? It’s impossible to tell. The proportions are way off.
That’s where normalization or scaling can come in handy. Basically, a very proper way to make a beautiful yet informative graph would be to change all of the above data points in accordance with the following formula, where x is the count of logs over a given time period for a particular data source:
x = (x – x.mean(axis=0)) / x.std(axis = 0)
This is called z-score standardization. Or standardization. Or normalization. It depends on who you’re talking to. Basically, this will rescale all of the values to have a mean of 0 and a standard deviation of 1. This would change our line graphs to all be relatively similar to each other in proportion, with significant spikes/drops very visible and obvious.
Here’s a hypothetical example leveraging PseudoMySQL:
-- Step 1: Calculate mean and std deviation for each Vendor over the past 30 days
WITH Stats AS (
    SELECT
        Vendor,
        AVG(log_count) AS mean_count,
        STDDEV(log_count) AS std_count
    FROM (
        SELECT
            Vendor,
            DATE(LogTimestamp) AS log_date,
            COUNT(*) AS log_count
        FROM NetworkDeviceLogs
        WHERE LogTimestamp >= NOW() - INTERVAL 30 DAY
        GROUP BY Vendor, log_date
    ) AS DailyLogs
    GROUP BY Vendor
),
-- Step 2: Get log counts for the last 7 days
RecentLogs AS (
    SELECT
        Vendor,
        DATE(LogTimestamp) AS log_date,
        COUNT(*) AS log_count
    FROM NetworkDeviceLogs
    WHERE LogTimestamp >= NOW() - INTERVAL 7 DAY
    GROUP BY Vendor, log_date
)
-- Step 3: Join the stats with recent logs and apply normalization formula
SELECT
    rl.Vendor,
    rl.log_date,
    rl.log_count,
    (rl.log_count - s.mean_count) / s.std_count AS normalized_log_count
FROM RecentLogs rl
JOIN Stats s
    ON rl.Vendor = s.Vendor
ORDER BY rl.Vendor, rl.log_date;
But because this is a visualization exercise and not a data science exercise, we can safely be dumber. In my everyday environment, because calculating z-score in our SIEM query language on a per-category basis is annoying, I simply divide all values by the mean over a large time period.
x = (x / x.mean(axis=0))
This scales the results down to everything being centered around 1. If a value is “5,” it means that it is 500% higher than the average of that log source for that time period.
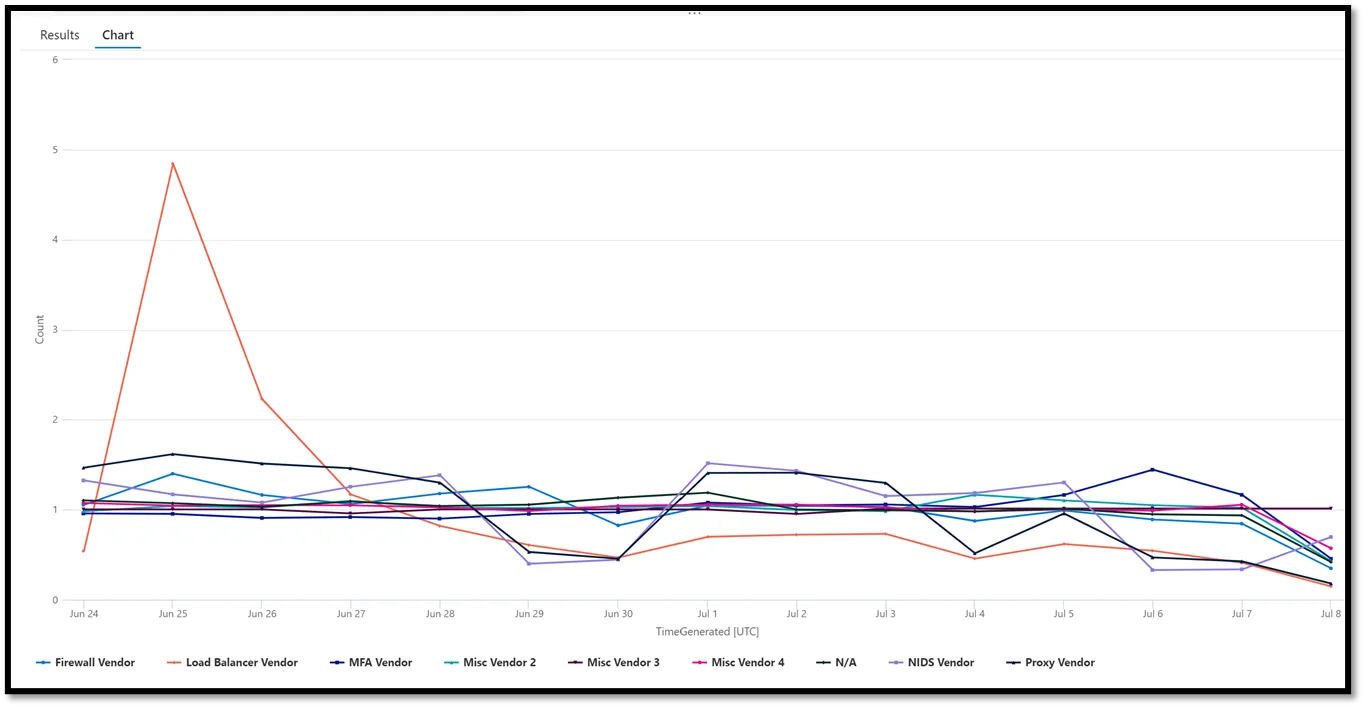
This is much better. Now we can easily tell that none of our major log sources seem to be having a major outage (this aggregates results by 24-hour periods, so the very last data point is always lower than expected), though our load balancer seemed to have an extreme quantity of logs for June 25th that might be working out to identify if there may be billing/performance (or even security) concerns.
I’ve used this exact setup for Windows event IDs, different log types on network devices (e.g., traffic logs, alert logs, system logs, authentication logs), and more. This can be a great gateway to identifying what outage criteria should be alerted on in the future.
Log Source Status Indicators
This idea is useful for log sources that do not support a heartbeat (e.g., phone home to SIEM) function and do not consistently send logs (e.g., a NIDS on a quiet network segment). Defining a policy for when to alert on such systems not sending logs can be annoying (do you want to have 10 different alerting configurations for 30 different NIDs systems? Does your current log source health monitoring setup support such customizability?)
Instead, especially for log sources with which I am not intimately familiar (and thus do not have a baseline I can use as a reference for alerting criteria), I like to create a dashboard item with general green/yellow/red statuses. Depending on the log source. A green status indicator might be something that logged as recently as today. A yellow indicator might be something that logged within the last 3 days. A red indicator might be something that has not logged for a longer period than that. It all depends on what’s being monitored.
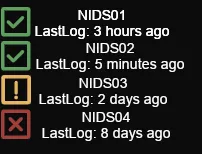
Chris Sanders talked about using this kind of visualization in a blog post on SOC dashboards in the form of green/yellow/red “data source availability.” This might not be exclusively limited to logs but can include other forensic artifacts, such as the presence of PCAP data. Eric Capuano’s thread on X on the same subject is also worth a read.
What Logs Do We Need?
This post has largely been focused on detecting and remediating log outages/overages. But, another big problem that organizations regularly contend with is determining what they need to log. There are a lot of answers to that question, and I think others have answered it better than I can.
Excellent Log Sources
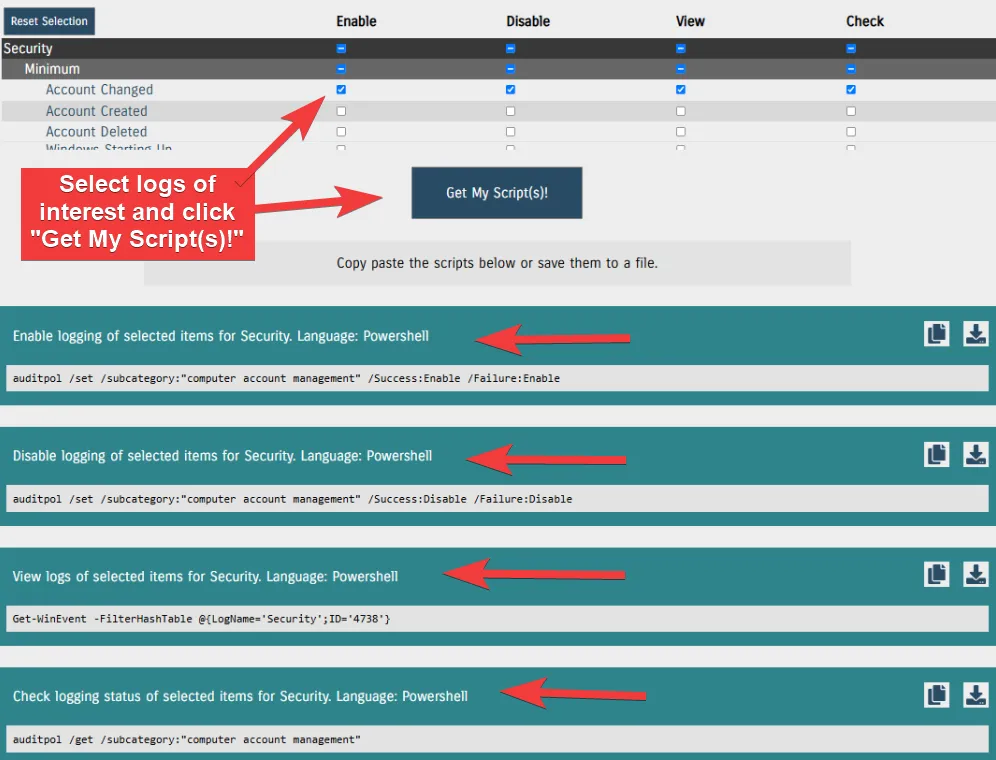
The first answer is simple: https://what2log.com/. This site, run by InfoSec Innovations provides automated scripts to enable, disable, view, and check “minimum,” “ideal,” and “extreme” levels for both application and security logs in Windows. They also provide guidance on viewing relevant logs of interest for Ubuntu.
Florian Roth also has a good thread (more than one, actually) on this topic that I generally agree with.
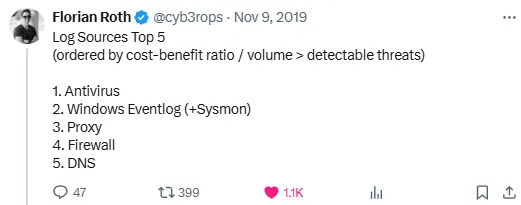
I think he has particularly great thoughts on firewall logs and the security industry’s (over) use of them.
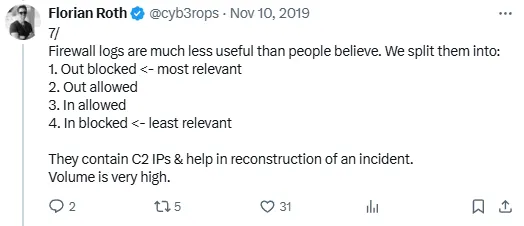
He’s very funny about it, too!

My personal favorite log source is a web proxy. If assets are leveraging a web proxy for their communications, there’s generally no better network evidence source than proxy logs. As simply as possible, they tell you 1. what sites an asset talked to (Url, Domain), 2. how they got there (request context / referer ), 3. when they got there (timestamp), 4. how much data was sent/received 5. the nature of the site visit (HTTP method — e.g., POST), and 6. if the connection was successful or not. If something fishy is happening on an endpoint, I find it’s often faster and easier to spot evil by looking at proxy logs than EDR telemetry.
Other log needs are generally dictated by your regulatory and organizational demands.
Use Case Management
Invariably, if you’re ingesting logs, someone will eventually ask you, “Are you sure you need these? Can’t we just get rid of this log and keep that other log?” It’s not an unfair question. Logging costs a lot. Ideally, you should have formal documentation on what log sources you need and why. This falls into the category of use case management. While that’s its own massive subject, I prefer to keep it simple. Have a document that has a table like this for your various log sources:
| Log Source | Event ID | Criticality | Description / Notes |
|---|---|---|---|
| Windows Security Log | 4688 | Critical | EID 4688 tells us what processes execute and with what arguments. This is a fundamental required log to identify suspicious activity in our environment. |
That same document should include formal definitions for levels of criticality. For example, if a log source is critical, it should be formally well-defined that not having those logs is an extreme impairment to the detection and response capabilities of the organization.
A really great project to explore with some opportunities for some very fast wins is the DeTT&CT framework from Rabobank. With this project, you can map log coverage to the MITRE ATT&CK framework to identify high-value log sources, redundancies, gaps, etc. Without even needing to download or spin up the project, the front page includes extremely valuable information:
python dettect.py generic -ds
Count  Data Source
--------------------------------------------------
255    Command Execution
206    Process Creation
98     File Modification
88     File Creation
82     Network Traffic Flow
78     OS API Execution
70     Network Traffic Content
58     Windows Registry Key Modification
58     Network Connection Creation
55     Application Log Content
50     Module Load
46     File Access
46     Web [DeTT&CT data source]
37     File Metadata
32     Logon Session Creation
26     Script Execution
22     Response Content
21     Internal DNS [DeTT&CT data source]
20     User Account Authentication
18     Process Access
...
From a single command, you can see which data sources within ATT&CK cover the most techniques. This is not a 1:1 perfect way to identify valuable log sources, but it’s an extremely strong indicator. As the output suggests, you should probably have command execution logs.
Wade Wells briefly discusses practical usage of DETT&CT in his Wild West Hackin’ Fest 2020 talk.
Final Thoughts
While we’ve not solved log source management, I hope this post at least sheds some light on the problem and inspires some creative thinking. I think that we, as a species, have gotten better at managing the problem. But new challenges in the forms of expanding and diversifying IT infrastructures, new bespoke cloud log sources, increased cost of logging, and the “ever-evolving threat landscape” ensure that the issue remains tricky to solve — in a fun and engaging way!